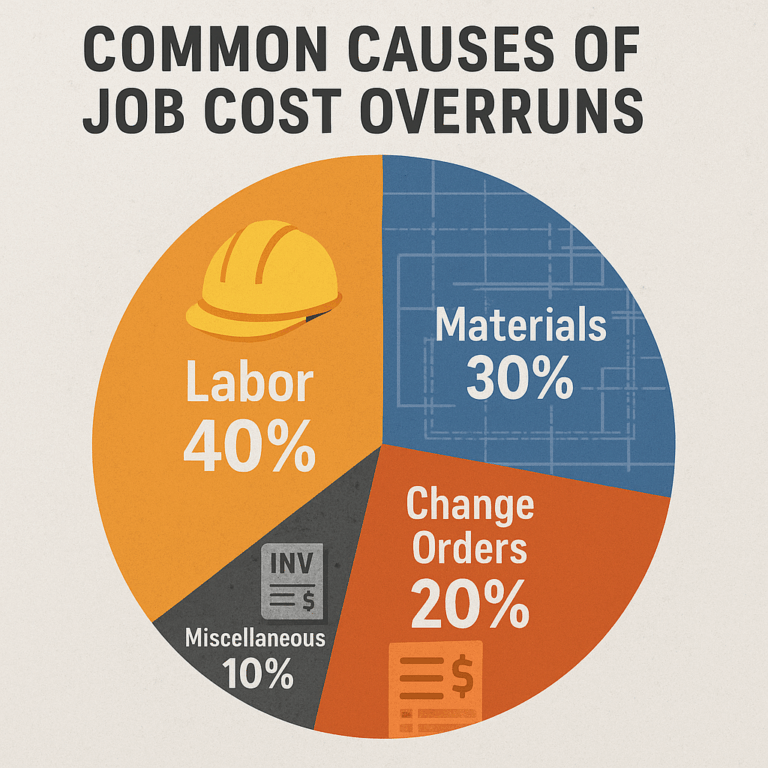
Pie chart showing a breakdown of typical cost overrun contributors (e.g., labor 40%, materials 30%, change orders 20%, other 10%)
Pie chart showing a breakdown of typical cost overrun contributors (e.g., labor 40%, materials 30%, change orders 20%, other 10%)